Penn State Particle Separator
Pennsylvania Sieve
OVERVIEW
The Forage and TMR Particle Separator was designed to help in
determining the correct forage particle length needed to improve
ruminant nutrition.
Having the proper particle size distribution of feeds is an
important part of ration formulation. However, until recently,
particle size has been difficult to measure on farms. Many dairy
nutritionists have developed subjective measures of this aspect of
the diet, and most have been quite effective making ration changes
with respect to particle size measurements.
FEATURES & BENEFITS
The Penn State Particle Separator (PSPS) provides a tool to
quantitatively determine the particle size of forages and total
mixed rations (TMR). The updated 2013 version of the PSPS adds the
ability to estimate physically effective fiber (peNDF) to this
tool. The objective of developing the PSPS was to mimic the complex
lab method with a simpler, on-farm method. The newest refinement
allows for an estimation of the quantity (%) of a forage or TMR
that provides physically effective fiber to the dairy cow.

Using the separator:
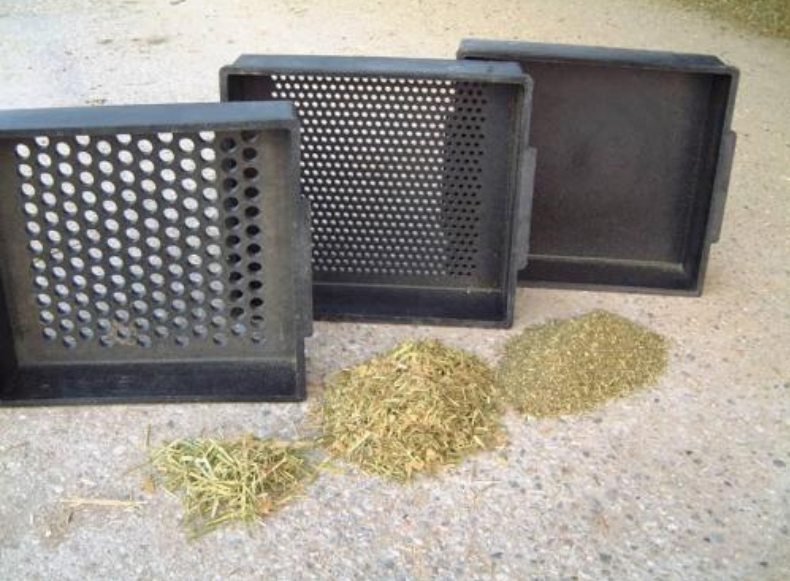
Stack the four plastic separator boxes on top of each other in the
following order: sieve with the largest holes (upper sieve) on top,
the medium-sized holes (middle sieve) next, then the smallest holes
(lower sieve), and the solid pan on the bottom. Place approximately
3 pints of forage or TMR on the upper sieve. Moisture content may
cause small effects on sieving properties, but it is not practical
to recommend analysis at a standard moisture content. Very wet
samples (less than 45 percent dry matter) may not separate
accurately. The separator is designed to describe particle size of
the feed offered to the animal. Thus, samples should not be
chemically or physically altered from what was fed before sieving.
On a flat surface, shake the sieves in one direction 5 times, then
rotate the separator box one-quarter turn. There should be no
vertical motion during shaking. Repeat this process 7 times, for a
total of 8 sets or 40 shakes, rotating the separator after each set
of 5 shakes.See the sieve shaking pattern shown in Figure :
SPECIFICATION
Example of the calculation of total weight and cumulative
percentages under each sieve.
Record and Calculate Data |
Sample | Weight Retained | Proportion Remaining On Each Sieve |
Upper sieve (0.75 inches) | 10 grams [a] | a/e * 100 = 10/200 * 100 = 5% |
Middle sieve (0.31 inches) | 80 grams [b] | b/e *100 = 80/200 * 100 = 40% |
Lower sieve (0.16 inches) | 40 grams [c] | c/e * 100 = 40/200 * 100 = 20% |
Bottom pan (< 0.16 inches) | 70 grams [d] | d/e * 100 = 70/200 * 100 = 35% |
Sum of Weights | 200 grams [e] | |
Compute Cumulative Percentage Undersized |
% Under upper sieve | f = 100 - (a/e *100) | 100 - 5 = 95% undersized |
% Under middle sieve | g = f - (b/e*100) | 95 - 40 = 55% undersized |
% Under lower sieve | h = g - (c/e*100) | 55 - 20 = 35% undersized |
Cumulative percentage undersized refers to the proportion of
particles smaller than a given size. For example, on average, 95%
of feed is smaller than 0.75 inches, 55% of feed is smaller than
0.31 inches and 35% of feed is smaller than 0.16 inches. |
Sieve | Diameter of the hole, mm | The size of the delayed particles | Recommended percentage in feed mixes |
Top Sieve | 19.0 mm | More than 19 mm | 2 - 8 % |
Medium sieve | 8.0 mm | 8 to 19 mm | 30 - 50 % |
Bottom sieve | 1.3 mm | 1.3 to 8 mm | 30 - 50 % |
Pallet | - | Less than 1.3 mm | Less than 20% |