Home Companies Shenzhen 3nh Technology CO., LTD

Sineimage Pre-distortion Test Chart Automotive Test Chart for testing automative cameras or other significantly distorte

Shenzhen 3nh Technology CO., LTD
Active Member

Contact Us

[China] country

Address: 4/F,Building 8,Nangang Second Industry Zone,Xili,Nanshan District,Shenzhen,China.

Contact name:melorae

Inquir Now

Shenzhen 3nh Technology CO., LTD

Sineimage Pre-distortion Test Chart Automotive Test Chart for testing automative cameras or other significantly distorte

Country/Region china
City & Province shenzhen guangdong
Categories Other Security & Protection Products
InquireNow

Product Details

Sineimage SFRplus Chart: Inkjet on Paper - 4:1 Contrast Ratio Transparent for MTF, distortion, tonal response, and color

Sineimage Pre-distortion Test Chart Automotive Test Chart


Sineimage Pre-distortion Test Chart Automotive Test Chart


ModelPre-distortion Chart
TypeReflective
Contrast Ratio10:1
Size1117 mm X 1524 mm


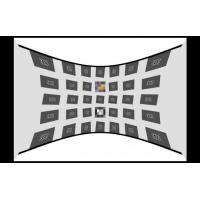
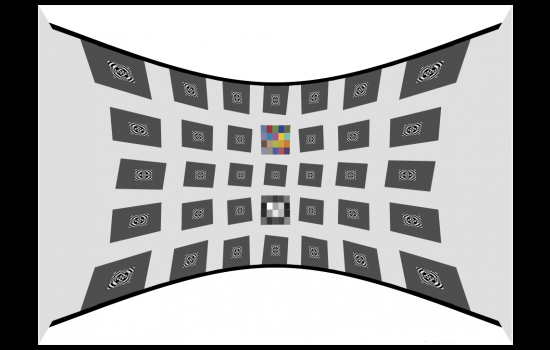
This Sineimage Pre-distortion Test Chart Automotive Test Chart is designed for testing automative cameras or other significantly distorted cameras. This large chart is designed to be reflectively lit, and captured at a an optimal focus distance.

Options include:

  • Pre-distortion: Most automotive camera modules have significant fisheye distortion which can make it difficult to the outside of the image field. this chart has pincussion pre-distortion to approximately compensate for the barrel distiortion of the automotive camera module. The distortion coefficients that should be entered into the Imatest SFRplus settings window are [1.167 1.577]
  • Square Grid: 5x7 slanted square grid
  • Substrate & ink type: Matte paper & ink can be used to reduce reflected light. This is critical for high levels of distiortion, otherwise specular reflections can ruin MTF measurements
  • Contrast levels: 10:1 contrast ratio, common for several automative testing standards
  • Color chart: a 20 patch color chart for color accuracy and bayer filter position verification
  • Bar to Bar height: the maximum bar to bar height is 38.5 inches on the left and right side. The minimum bar to bar height is 23.5 inches in the center.
  • Active Area: the extra-large chart be used for sensor sizes above 24 MP. This chart has an active area of 1500mm x 965mm and is printed on 1117 mm X 1524 mm inch paper

The active area of the chart includes white space above and below the top and bottom distortion bars. It is slightly larger than the printed area, which is bounded by the distortion bars on top and bottom. White space is included in active area because test images of the chart must include this white space in order to enable automated processing in SFRplus software.


Standard Version

Standard Version

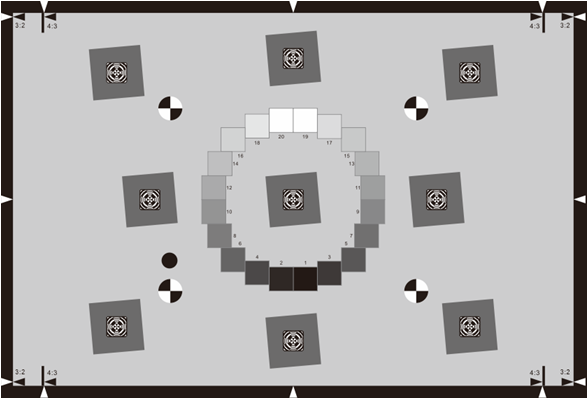
This chart, which has a 3:2 aspect ratio, is a "no-frills" implementation of the standard. For most work we recommend the Enhanced or Extended charts, which have additional edges for measuring performance near the image boundaries, as well as hyperbolic wedges and color patches (where the technology allows). These chartsmaintain full compliance with the standard.
The Imatest Standard ISO 12233:2014 E-SFR chart closely resembles the Low contrast E-SFR test chart illustrated in section 6.1 and Annex C of the ISO standard document, with a few differences, all of which are fully compliant with the ISO standard.

  • A 20 patch OECF grayscale pattern* is used instead of the 16 patch version.
  • The Focus Patterns in the centers of the squares are rectangular (to increase the MTF measurement area) and are designed to reduce interference with automatic edge detection.
  • There are four registration marks instead of three to facilitate automated region detection. (Four features are required for a projective transform.)
  • An additional mark above the lower-left registration mark is used for detecting chart orientation.

Enhanced Version

Enhanced Version

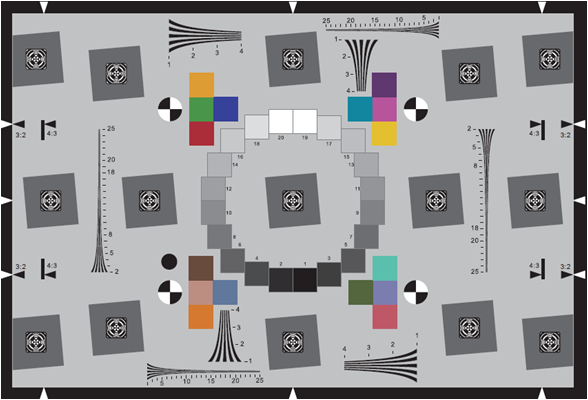
The Imatest Enhanced ISO 12233:2014 E-SFR chart has all the features of the Standard chart, keeping the 3:2 aspect ratio, with the addition of six added slanted squaresfor measuring performance near the image boundaries and hyperbolic wedges for visual analysis or analysis with the Imatest Wedge module. It also has 16 color patches when produced with technologies that allow color. Since these additions are in regions of the chart not covered by the standard, compliance with the standard is unaffected.

The differences between the Imatest charts and the chart illustrated in the standard are listed below. Even with these differences the Imatest chart is in full compliance with the standard.

  • A 20 patch OECF grayscale pattern* is used as opposed to the 16 patch version.
  • The Focus Patterns in the centers of the squares are rectangular (to increase the MTF measurement area) and are designed to reduce interference with automatic edge detection.
  • There are four registration marks instead of three to facilitate automated region detection. (Four features are required for a projective transform.)
  • An additional mark above the lower-left registration mark is used for detecting chart orientation.

The differences between the Enhanced and Standard Versions are as follows:

  • Six extra slanted squares are added for measuring performance near the image boundaries.
  • Several hyperbolic wedges with spatial frequencies, similar to the CIPA chart referenced in the ISO standard, for visual analysis or use with the Imatest Wedge module.
  • 16 color patches when produced with technologies that allow color (inkjet or color LVT), with colors similar to the industry-standard 24-color test chart.

This chart will work with the fully-automated eSFR ISO module.


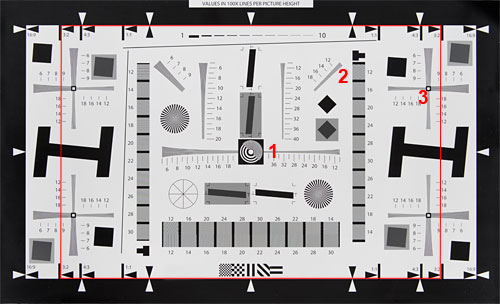
The values of the 11-graduated gray scale are as follows:
 

StepDensityReflectance in %
10.0589
20.1374
30.2260
40.3248
50.4337
60.5528
70.6920
80.8813
91.068
101.315
111.652


The density values are based on BaSo4 = 0. Two black fields and a white field are located between the gray scales, the density of the black filed is D > 2.4 (reflectance < 0.5 %). The density of the white filed is D = 0.05 (reflectance = 89.9 %).


Hot Products

NH310 plastic raw materials colorimeter color test equipment color meter chroma meter cr10 plus ...
YS3060 plastic masterbatch colorimeter spectrophotometer with 8mm 4mm aperture konica minolta ...
YS3060 plastic masterbatch spectrophotometer for color matching with software 8mm 4mm Xrite cm2600d ...
PVC pipes raw material color difference spectrophotometer with accessory powder test box 8mm ...
Non woven screen printing ink spectrophotometer color matching machine manufacturer 8mm aperture ...
Calcium carbonate powder spectrophotometer whiteness test meter with 8mm aperture ns800 45/0 CIE lab ...